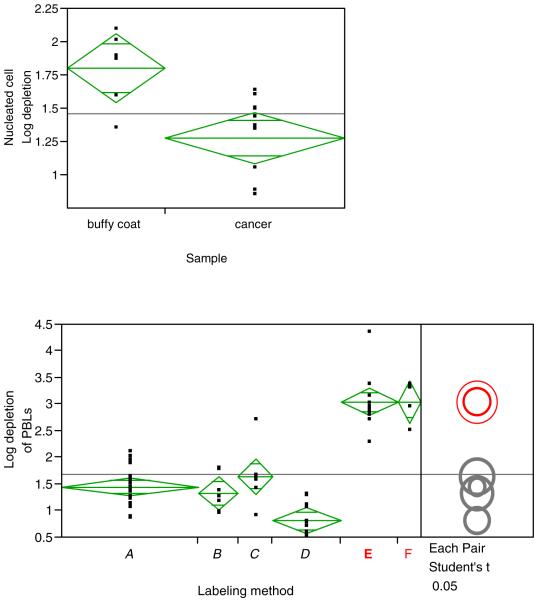
Figure 8.
JMP software graphical presentation of immunomagnetic depletions as measured by the log10 depletion of nucleated cells. Figure 8A compares the depletion results of blood from buffy coats and cancer patients, both blood sample immunomagnetically labeled with Protocol A. 8B compares the depletion results (n = 61) of blood from cancer patients, buffy coat, and normal individuals using the six different labeling protocols presented in Figure 2.

