Figure 3.

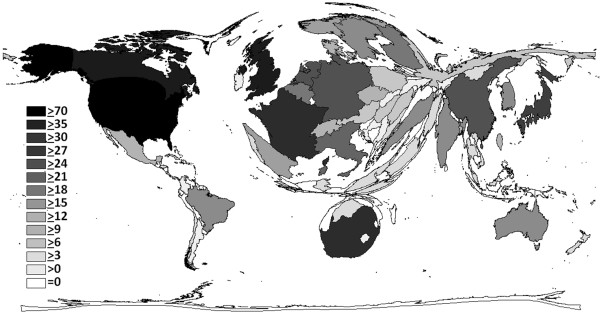
Density-equalizing map showing the h-index of each particular country. The area of each country was scaled in proportion to its h-index regarding “silicosis”.

Density-equalizing map showing the h-index of each particular country. The area of each country was scaled in proportion to its h-index regarding “silicosis”.