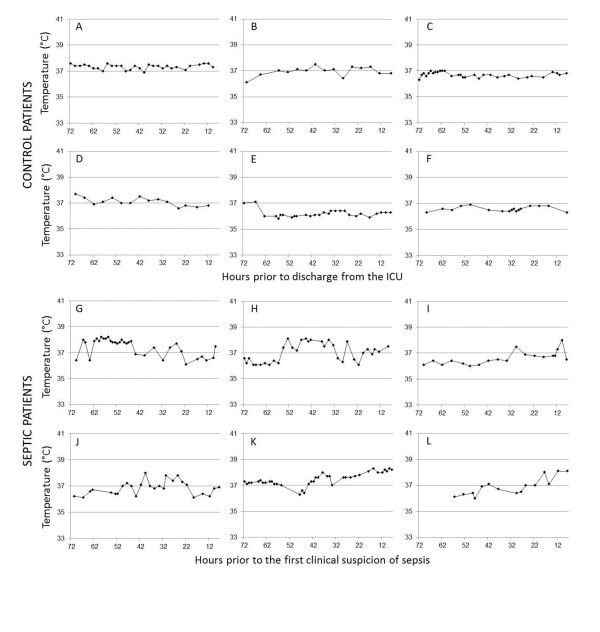
Figure 3.
Example temperature curves from afebrile septic and control patients. The horizontal axes represent hours prior to the clinical suspicion of sepsis (in septic patients) or hours prior to discharge from the ICU (in control patients). The timestamp for the clinical suspicion of sepsis was defined as the time of the first fever, the time of the first culture (from any site) or the time the first antibiotic was ordered by the ICU medical staff, whichever came first. Note that the temperature plots end eight hours prior to the first clinical suspicion of sepsis.

