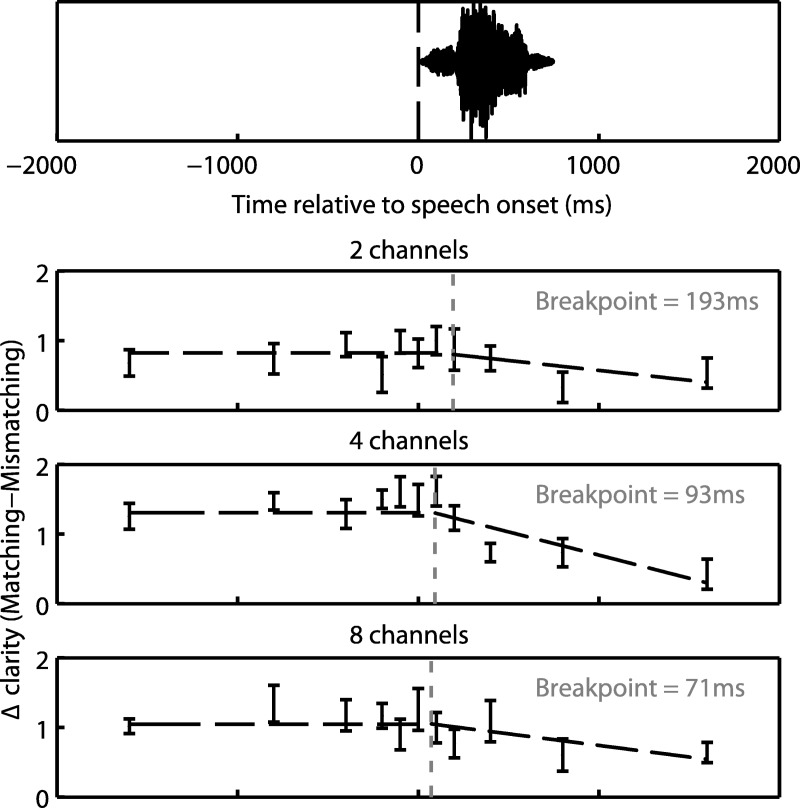
Figure 5.
Δ clarity (relative to the mismatching condition) in Experiment 2 as a function of SOA. Each data point represents Δ clarity for the 11 SOA conditions; their x-axis locations can be interpreted as the latencies when written text was presented (relative to speech onset, see top panel for an example spoken word). Error bars represent SEM across participants corrected for between-participants variability (see Loftus & Masson, 1994). The black dotted lines represent the breakpoint models given by the mean best-fitting parameters across participants (see main text for details). The vertical gray lines indicate the locations of the mean best-fitting breakpoints.

