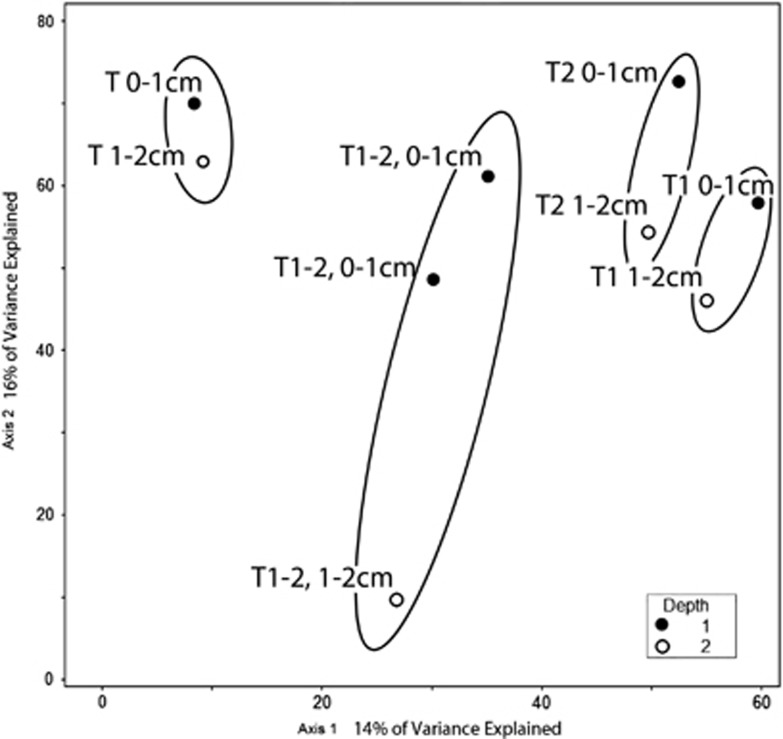
Figure 4.
Biplot generated from Cannonical Correspondence Analysis of the 18S rRNA data set from Highborne Cay, Bahamas, for all eukaryotes clustered at the 97% sequence identity level. Sampled microbialite types are circled. Depths of each sample are noted. Filled circles represent 0–1 cm fractions and hollow circles represent 1–2 cm fractions. Mat type noted for each sample. (note: T1=Type 1, T2=Type 2, T 1-2=Incipient Type 2 mat, T=Thrombolite).

