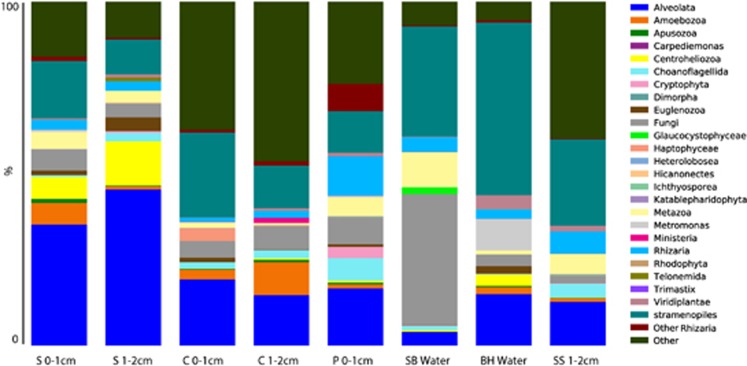
Figure 6.
Stacked histogram of eukaryotic OTU composition of (97% sequence similarity, weighted data presentation) Hamelin Pool, Australia, microbialite and water samples based on SSU rRNA signatures (cDNA template). Y axis corresponds to fraction of OTUs affiliating with each grouping out of 100%. BH water, coastal enclosed sulfidic water body behind beach on Hamelin Pool, ∼20 km from microbialite sampling site; C, colloform; P, Pustular; S, smooth mat; SB water, Shark Bay (Hamelin Pool) waters at microbialite sampling site; SS, smooth scoured.

