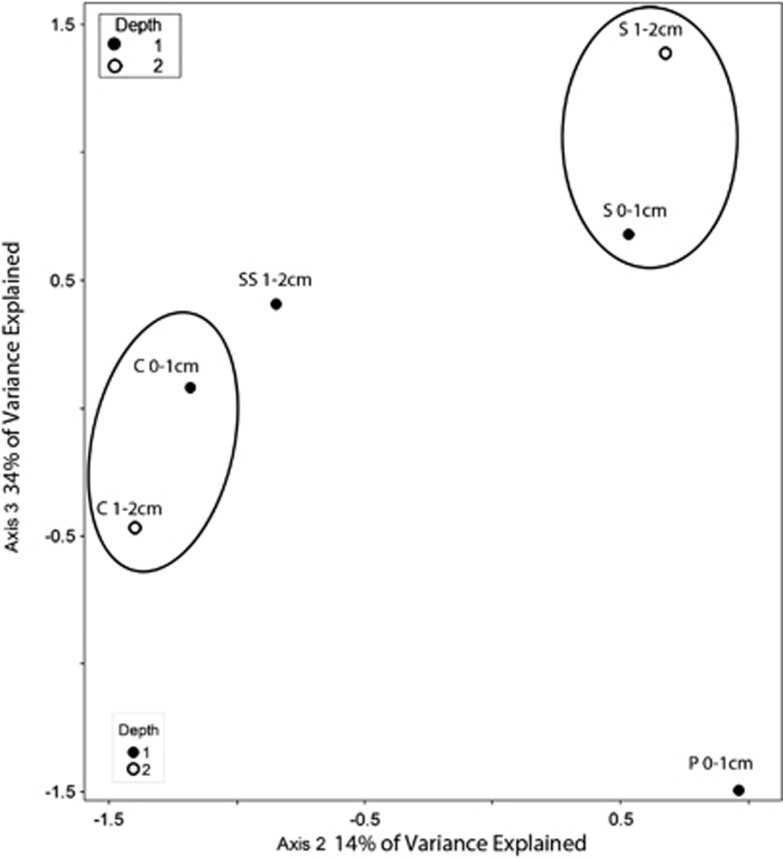
Figure 7.
Biplot generated from Cannonical Correspondence Analysis of our 18S rRNA data set from Hamelin Pool, Australia, for all eukaryotes clustered at the 97% sequence identity level. Sampled microbialite types are circled. Depths of each sample are noted. Filled circles represent 0–1 cm fractions and hollow circles represent 1–2 cm fractions. C, colloform mat; P, pustular mat; S, smooth mat; SS, smooth scoured mat.

