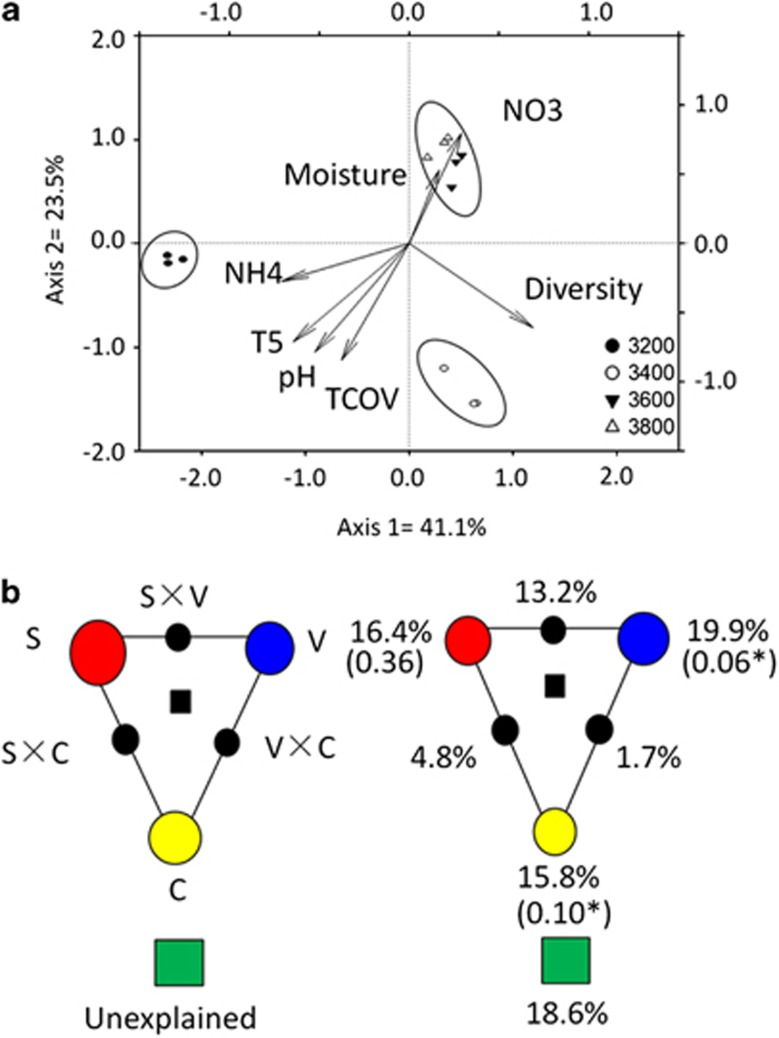
Figure 7.
(a) CCA of GeoChip data and geochemistry attributes: soil pH, NO3−–N, NH4+–N, the temperature of 5 cm depth in soil (T5), the total coverage of vegetation (TCOV), the alpha diversity of vegetation (diversity), soil moisture (moisture). The percentage of variation explained by each axis is shown and the relationship is significant (P<0.05). (b) Partitioning of microbial diversity variance among important geochemical attributes, soil chemistry including soil pH, moisture, ammonia and nitrate (S), soil climate attributes including soil temperature and soil moisture of 5 cm depth (C), vegetation including total coverage and diversity (V), and their interactions (S × V, S × C and V × C). The values in parentheses are P-values.

