Fig 1.

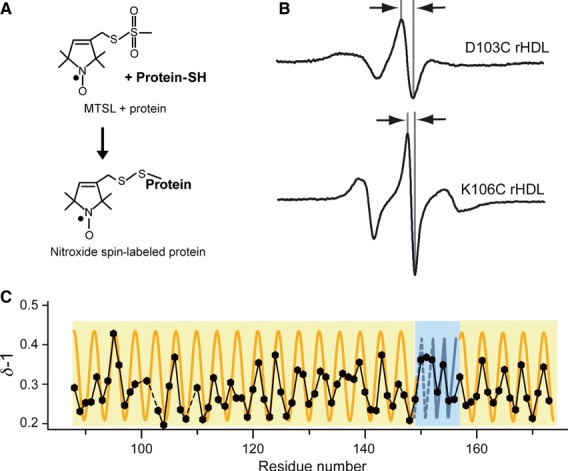
EPR spectroscopy was used to determine the structure of the central domain of ApoA-I on 9.6-nm rHDL particles. (A) ApoA-I on 9.6-nm rHDL bearing a nitroxide label (MTSL) was analyzed by EPR spectroscopy. (B) The central line width (arrows) of the resulting spectra is representative of the labeled amino acid's side chain mobility, where broader (D103C, top) and narrower (K106C, bottom) line widths indicate low and high mobility, respectively. (C) The inverse spectral line width (δ−1) plotted as a function of residue number is used to identify secondary structure elements. Solid and dashed black lines indicate consecutive and missing data points, respectively. A sinusoidal-shaped periodicity of 3.6 residues per cycle indicates an α-helical structure (orange), whereas an alternating periodicity indicates a β-strand structure (blue). Data for residues 88–173 are plotted, wherein residues 99–163 are from the current study.
