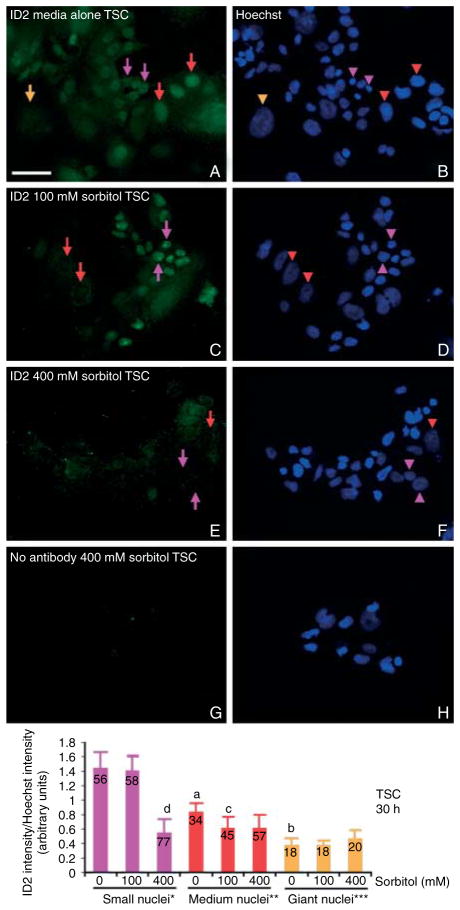
Figure 4.
Hyperosmolar stress leads to destruction of ID2 protein in nearly all cells at high doses (400 mM), but lower doses (100 mM) spared ID2 in TSCs with small nuclei. TSCs were cultured in 0 mM (A and B), 100 mM (C and D), or 400 mM (E and F) sorbitol for 30 h and then fixed and stained for ID2 using indirect immunocytochemistry. In (G and H), 400 mM sorbitol-treated TSCs were probed without primary antibody; (B, D, F, and H) are the Hoechst-stained nuclei corresponding to cells in (A, C, E, and G) respectively. The orange arrow and arrowhead show the position of the protein corresponding to its nucleus of a giant cell (>2000 arbitrary units), red arrows and arrowheads show the protein and medium-sized nuclei (1000–2000 arbitrary units), and purple arrows and arrowheads show the protein and small TSC nuclei (100–999 arbitrary units). Histogram shows the mean intensity of ID2/intensity of Hoechst to normalize depth of nuclei, Y error flags are S.D., and numbers in bars show number of nuclei counted. Statistical comparisons show, in unstressed TSCs, the decrease in ID2 intensity from small to medium (a) and medium to giant nuclei (b) are each significant (P<0.005). The decreases in ID2 intensity in medium-sized nuclei from unstressed to 100 mM (c) and in small nuclei from unstressed or 100–400 mM (d) are significant (P<0.001). This is a representative experiment from three similar experiments.

