Figure 6.
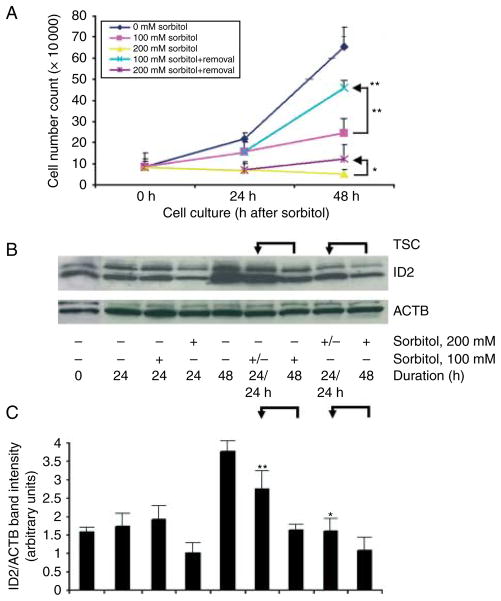
Cell accumulation rates and ID2 increase 24 h after 100 or 200 mM sorbitol is removed from cultured TSCs. (A) TSCs were cultured without sorbitol or with 100 or 200 mM sorbitol for 24 h, and then sorbitol was removed or continued. TSCs were counted using Trypan blue at 0, 24, and 48 h. The constant stress groups were designated by unchanged color for 0–48 h at 100 mM (yellow) and 200 mM (light purple). The blue line represents a removal of 200 mM sorbitol in 24–48 h and the dark purple line represents a removal of 100 mM sorbitol in 24–48 h. (B) TSCs were cultured with or without 100 or 200 mM sorbitol for 24 h, then sorbitol was removed or continued, and cell lysates were fractionated by SDS–PAGE and probed for ID2 and reprobed for ACTB. (C) Histogram shows the ratio of ID2/ACTB band intensity. Error flags are S.D.s for triplicate experiments. In (A) and (C), arrows show the comparison of 48 h with sorbitol and 24 h of sorbitol followed by 24 h without it. In (A), * and ** show the significant (P<0.01 and P<0.001 respectively) increase in cell number when 200 and 100 mM sorbitol were removed for the second 24 h. The top ** indicate a significant decrease in cell number from 0 to 100 mM sorbitol. In (C), * and ** show the significance (P<0.01 and P<0.001 respectively) when 200 or 100 mM sorbitol was removed for the second 24 h.

