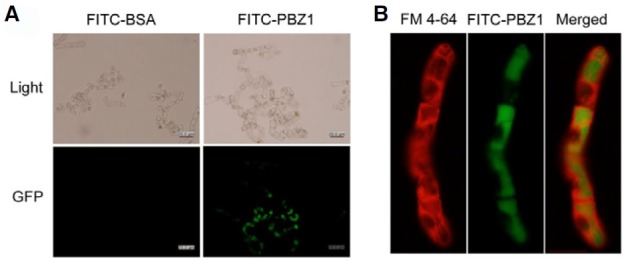
Fig. 5. Internalization and localizatio n analyses of BY-2 cells incubated with FITC-PBZ1. (A) Internalization analysis of FITC-PBZ1 or FITC-BSA (control). Images of light and fluore scence signals were observed by Co nfocal microscopy. Scale bars are 20 μm. (B) Localization of FITC-PBZ 1. Treated cells were stained with plasma-membrane fluorescence dy e FM 4-64 in red (FM 4-64). FITC signal of FITC-PBZ1 was detected under green filter (FITC-PBZ1). FM 4-64 and FITC-PBZ1 signals were merged to observe the localization of PBZ1 (Merged).