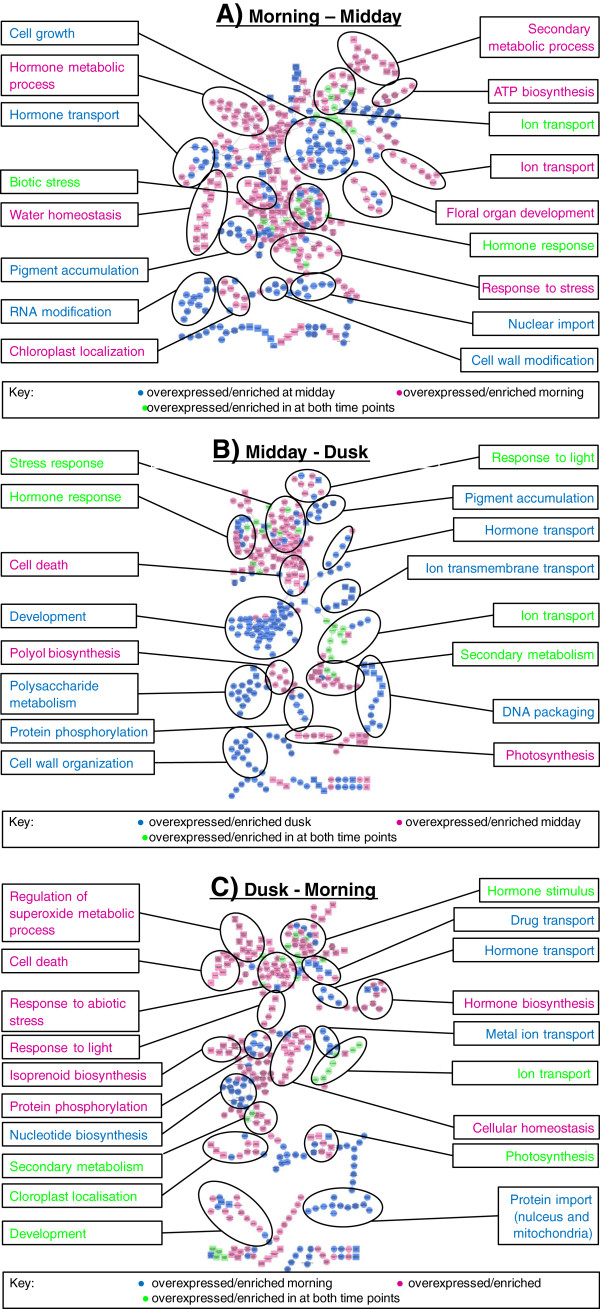
Figure 5.
Map of enriched GO terms at different times of the day, by pairwise comparison. The map shows parent/child connections between GO terms. GO terms are coloured pink, blue and green depending on the enriched expression profile. The GO map is annotated with summary descriptions highlighted by larger circling of GO terms. The GO cluster descriptions colours correspond to the GO terms and which are described in the key. Pairwise comparisons are displayed in a, Morning – Midday; b, Midday – Dusk and c. Dusk – Morning

