
Figure 8.
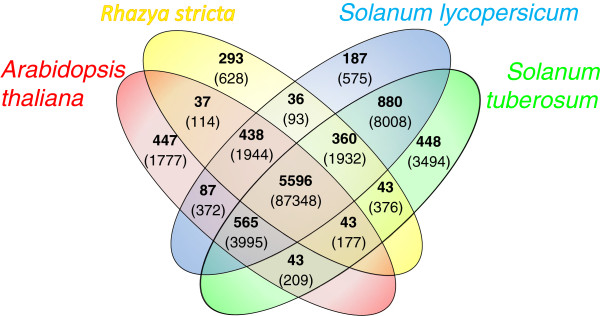
Clusters of orthologous proteins between A.thaliana, R.stricta, S.lycopersicum and S. tuberosum, using OrthoMCL; shown in red, yellow, blue and green, respectively. Within the Venn diagram; bold shows the number of orthologous groups and within brackets shows the number of proteins.