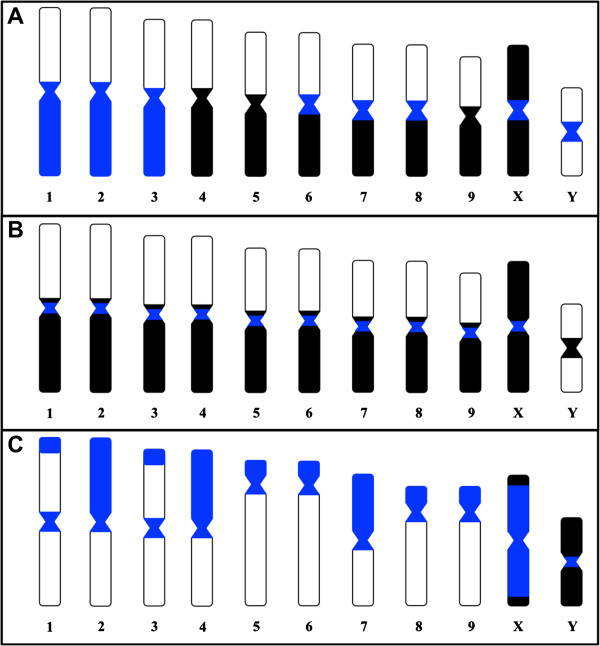
Figure 2.

Schematic ideogram showing the hybridization patterns described for Coprophanaeus cyanescens (A), C. ensifer (B) and D. mimas (C). Black represents the distribution of heterochromatin revealed by C-banding according to previous works [25,27] and C0t-1 DNA. Blue represents the distribution of Mariner elements.
