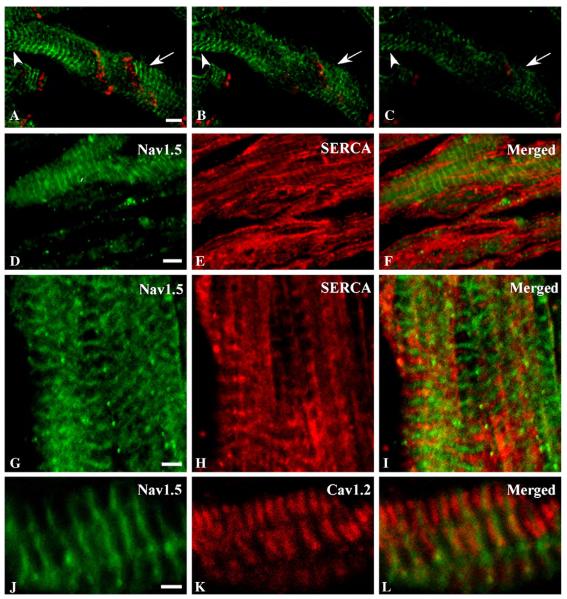
Fig. 2.
Localization of Nav1.5 relative to SERCA ATPase and CaV1.2. (A–C) Images from a z-series through atrial tissue stained with anti-Nav1.5 (green) and anti-connexin 43 at the cell surface (A) and progressively deeper sections (B and C) to confirm surface localization of sodium channel proteins. Arrows and arrowheads emphasize locations where depth-dependent changes in staining are particularly evident. (D–F) Optical plane showing both cell surface and intracellular staining for Nav1.5 (green, D and F) and SERCA ATPase (red). (G–I) Distribution of Nav1.5 (green, G, I) relative to SERCA ATPase (red, H, I). J–L, Localization of Nav1.5 (green, J, L) relative to CaV1.2 (red, K, L). Scale bars A–F = 5 μm; G–L = 2 μm.

