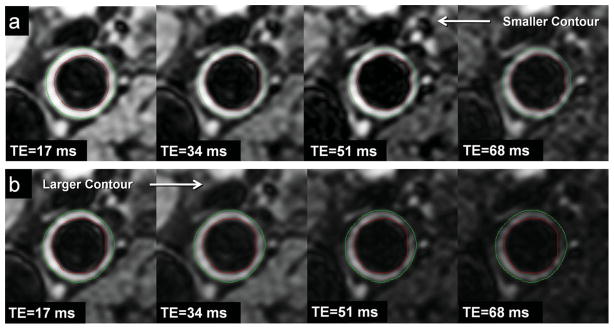
Figure 2.

Two contouring methods used for calculating T2 relaxation. a: Lumen and outer wall contours were traced on the image from the fourth echo (TE = 68 ms) and propagated to the images from the preceding echoes (i.e., smaller contour). b: Contours were traced on the image from the first echo (TE = 17 ms) and propagated to the images from the subsequent echoes (i.e., larger contour). [Color figure can be viewed in the online issue, which is available at wileyonlinelibrary.com.]
