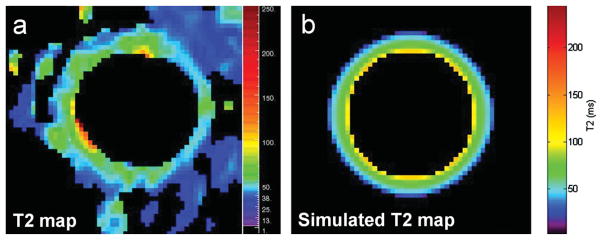
Figure 3.

T2 map of the CCA wall shown in Figure 2 based on in vivo data (a) and corresponding T2 map based on the analytic vessel model derived from values reported in the literature (b). The T2 map (a) was generated based on a mono-exponential voxel-by-voxel fit of signal intensity measurements of the CCA wall at each echo time. The simulated T2 map (b) was generated based on the estimated signal intensities of the vessel wall at each echo fit to a mono-exponential curve.
