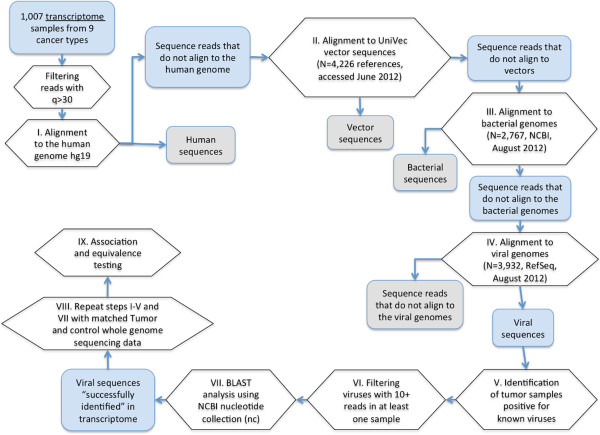
Figure 1.
Data analysis flowchart. Before step I, sequencing reads with phred-like quality scores q < 30 were removed. N in steps II, III, and IV reflects the number of reference sequences from corresponding databases. For the alignment in steps II, III, and IV, we combined reference fasta files into ‘supergenomes’ including vector sequences, bacterial genomes, and viral genomes, respectively. Each individual reference sequence in the ‘supergenome’ was treated as a chromosome. All supergenome reference files were indexed before alignment steps.

