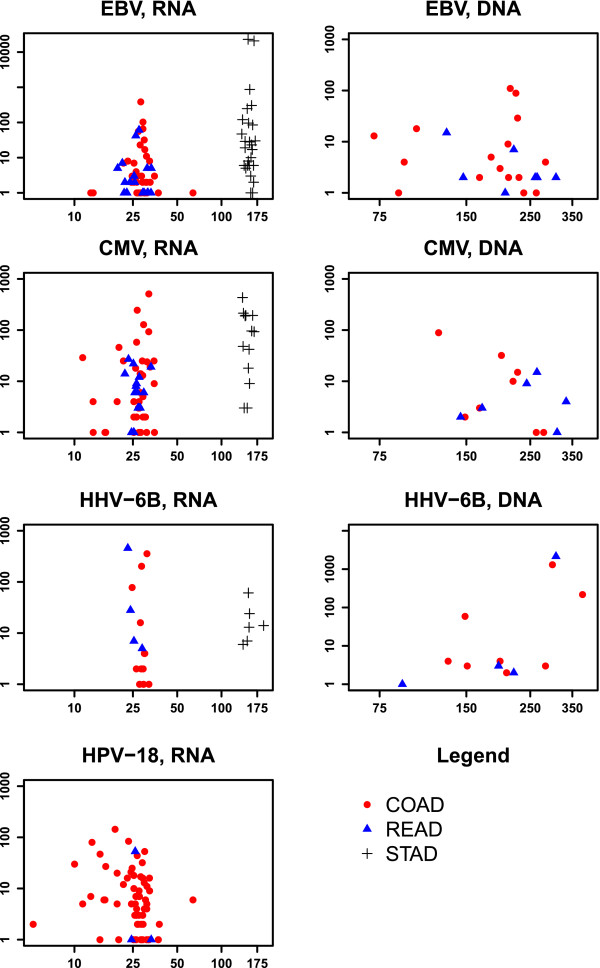
Figure 3.
Number of sequencing reads mapped to virus reference versus the total number of reads. The X-axis shows total RNA or DNA fragments (short sequencing reads) in millions, and the Y-axis shows the number of fragments mapped to the particular virus, as stated in the plot subtitles. Each data point represents one tumor. HPV-18 DNA was not detectable in the whole genome sequencing data. COAD are depicted as read circles, READ as blue triangles, and STAD as black plus signs.

