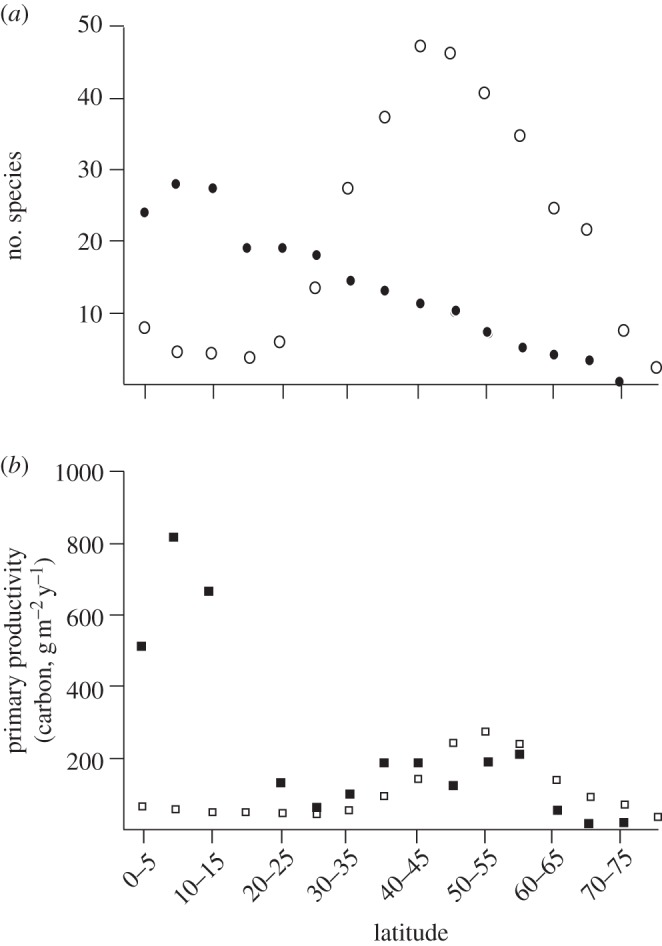
Figure 1.

Evidence for the productivity hypothesis for the evolution of diadromy, adapted from Gross et al. [23]. (a) The number of all known anadromous (open circles) and catadromous (filled circles) fish species found across 5° latitudinal increments averaged from both Northern and Southern hemispheres, based on McDowall [18]. Diadromy occurs across the major craniate groups, from lampreys to percomorphs. (b) Annual primary productivity (measured in grams of carbon fixed per square metre per year) of aquatic biomes across different latitudes. Freshwater data (filled squares) averaged from 135 different water bodies; marine data (open squares) from Bunt [24]. See [23] for details on how species numbers and primary productivity were calculated.
