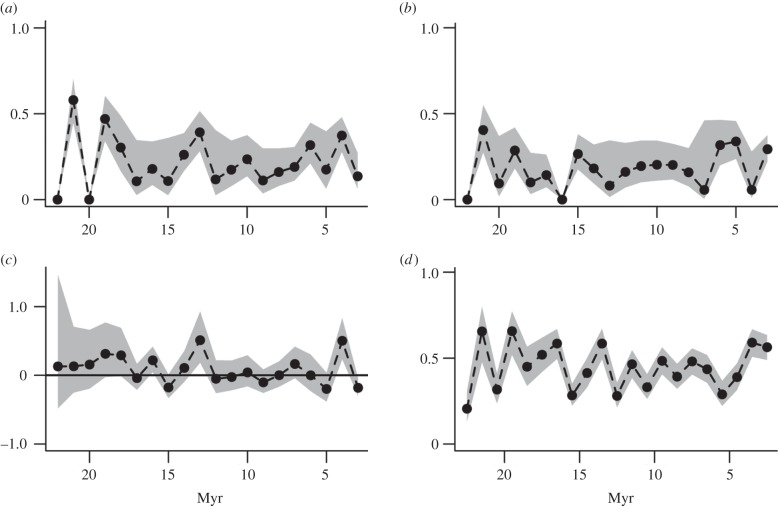
Figure 1.
Evolutionary and sampling dynamics. (a) Speciation probability, (b) extinction probability, (c) net diversification rates (horizontal line shows zero net diversification) and (d) sampling probability. These estimates are for all carnivoran species in the Neogene database, using the time-varying model (see the electronic supplementary material). Shaded areas are 95% CIs. Note that estimates in figure 1a–c are from the plotted time interval to the next, whereas estimates in figure 1d are for the time interval (midpoints are plotted).

