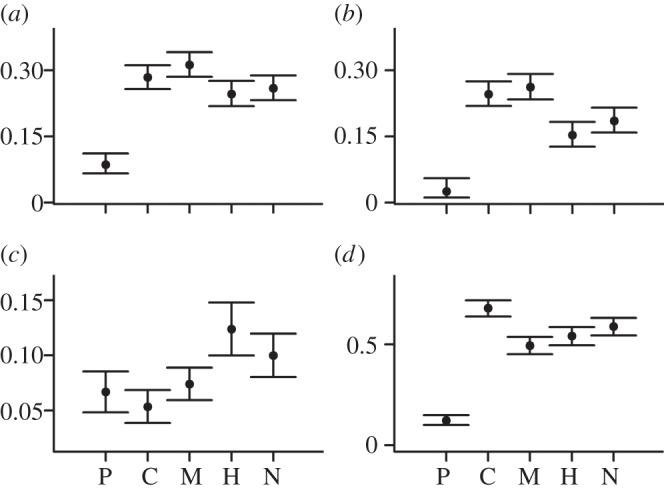
Figure 2.

Comparisons among carnivoran groups. (a) Speciation probability, (b) extinction probability, (c) diversification rates and (d) sampling probability. These estimates are for all carnivoran species using the group effects model. P, C and M are the caniform groups Pinnipedimorpha, Canidae–Amphicyonidae–Ursidae and Musteloidea, respectively. H and N are the feliform groups Herpestidae–Hyaenidae–Eupleridae and Nimravidae–Felidae–Viverridae, respectively (see electronic supplementary material, figure S1). Vertical lines indicate 95% CIs.
