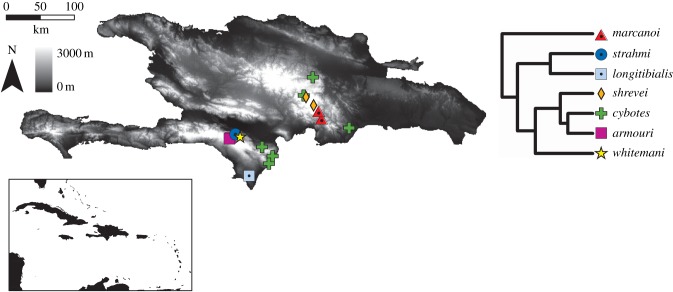
Figure 1.
Map showing altitudinal variation and the localities for each cybotoid population sampled in this study. The map inset shows the location of Hispaniola with respect to the other islands in the Caribbean basin. Greyscale indicates elevation and range from dark (low) to light (high) elevation. Species are denoted in different colours and shapes in the phylogeny generated based on Mahler et al. [16] (see Material and methods).

