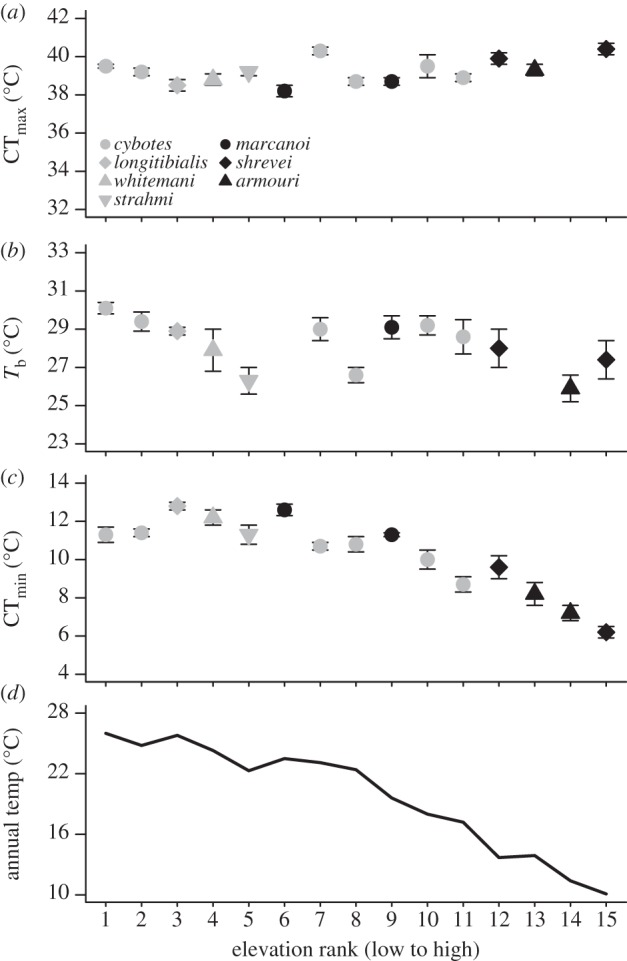
Figure 2.

Population means (±1 s.e.m.) are given for critical (a) thermal maximum (CTmax), (b) body temperature (Tb), and (c) critical thermal minimum (CTmin). The mean annual temperature for each locality is provided in (d). The x-axis denotes elevation rank for each population. Species are denoted in different colours and shapes.
