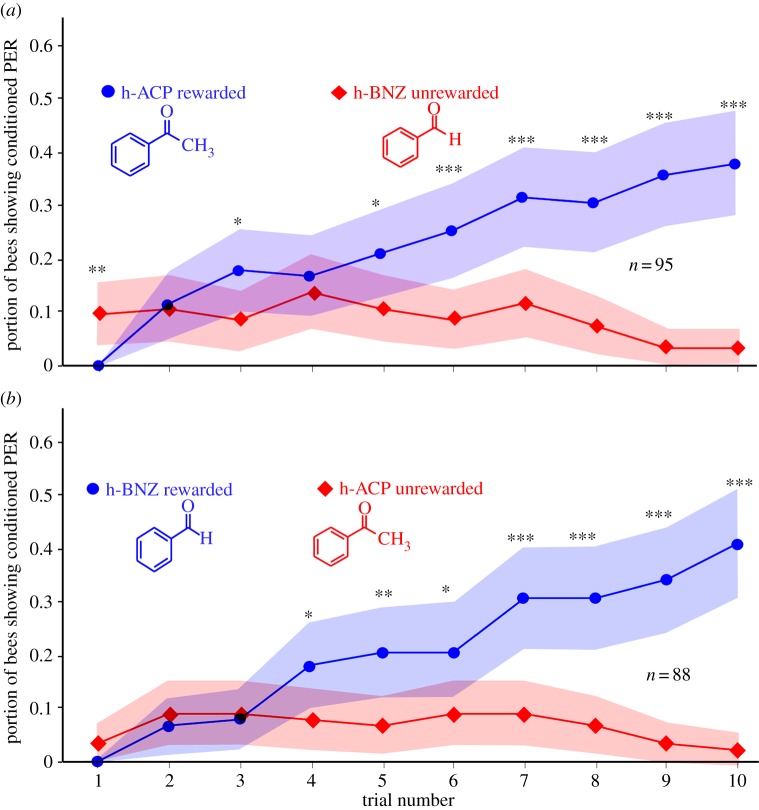
Figure 3.
Learning curves (differential conditioning; portion of bees showing conditioned proboscis extension response (PER)) for common (non-deuterated) compounds. (a) ‘h-ACP’ (rewarded) versus ‘h-BNZ’ (not rewarded); (b) ‘h-BNZ’ (rewarded) versus ‘h-ACP’ (not rewarded). Shaded areas show 95% CIs; differences between curves statistically significant (ANOVA; (a): p < 10−17; F = 78; n = 95 bees; (b): p < 10−18; F = 84; n = 88 bees); significance levels for comparison of individual trials (t-tests) are *p < 0.01; **p < 0.001; ***p < 0.0001. Note initial odour generalization during the first two (a) or three (b) trials. (Online version in colour.)

