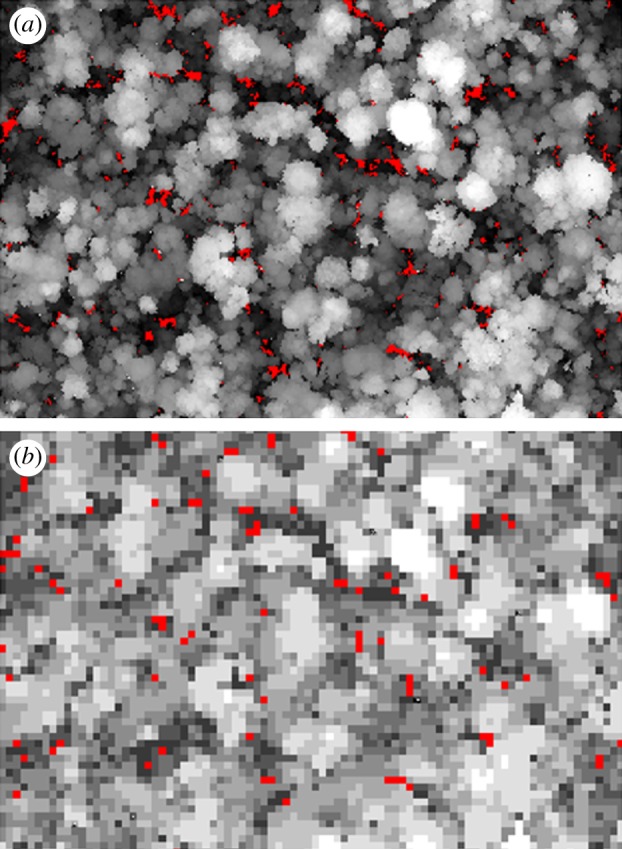
Figure 2.

A 10 ha sample of the BCI 50 ha plot selected to show canopy height (greyscale) and gaps less than 5 m canopy height (red). (a) Fine spatial resolution typical of LiDAR (1 m2 pixels) and (b) coarse spatial resolution typical of field data (25 m2 pixels).
