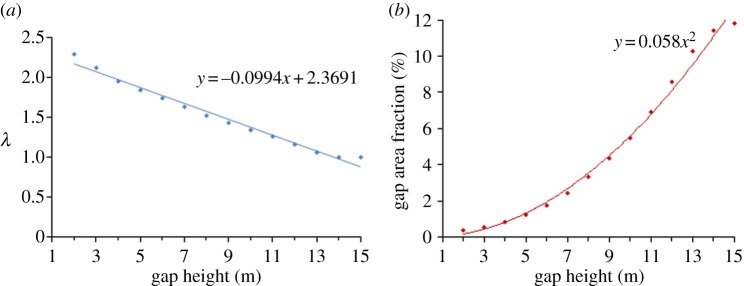
Figure 3.

(a) Landscape pattern of λ and (b) fraction of gap area versus maximum gap height. All coefficients had p < 0.005; r2 values for the regressions of λ and fraction of gap area versus maximum gap height were 0.981 and 0.996, respectively. (Online version in colour.)
