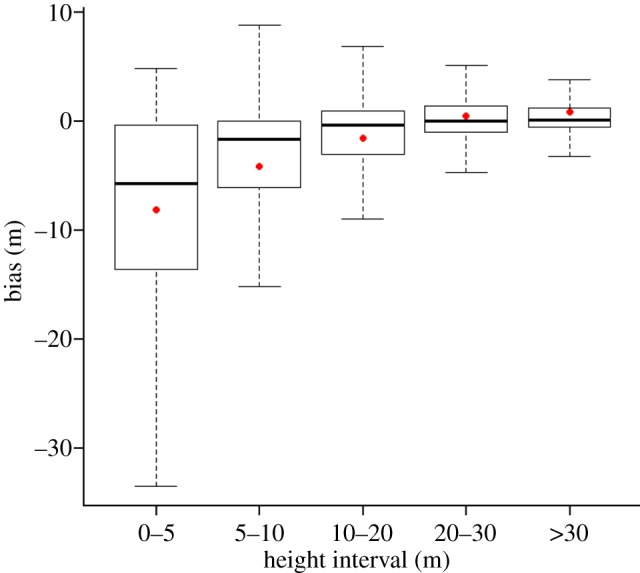
Figure 4.

Box plot showing bias in canopy height estimates when using coarse spatial resolution for canopy height estimates across different canopy height intervals (from 0 to more than 30 m); bias is defined as the height of simulated field data with coarse spatial resolution minus the height from LiDAR data with fine resolution. Box plot shows the median, first and third quartile; the whiskers represent the maximum and minimum values of the distribution; dots show the mean bias for each height interval. (Online version in colour.)
