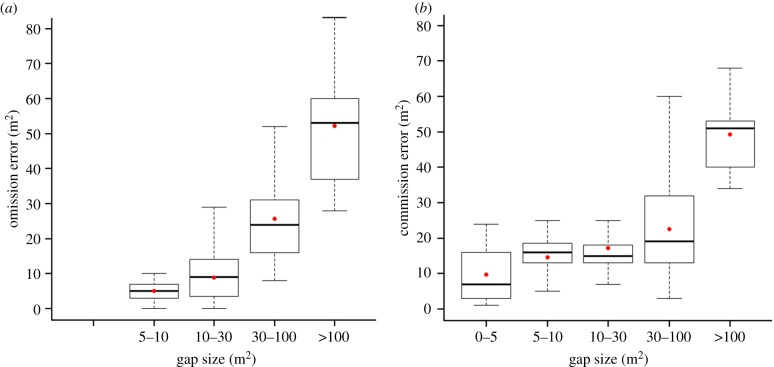
Figure 5.
Box plots showing (a) omission and (b) commission errors by gap size when using coarse versus fine spatial resolution. Box plot shows the median, first and third quartile; the whiskers represent the maximum and minimum values of the distribution; dots show the mean value for each gap-size interval. The sum of omission errors is 50% and the sum of commission errors is 79%. (Online version in colour.)

