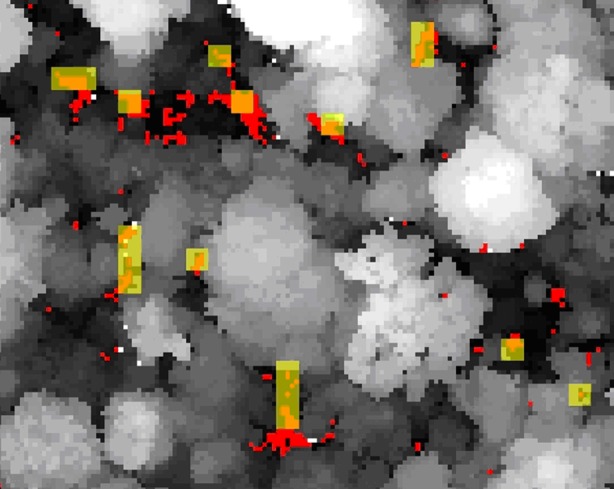
Figure 6.

A 1.4 ha sample of the plot showing canopy height (greyscale). Red areas represent gaps defined using fine spatial resolution LiDAR, pale yellow areas indicate gaps defined using coarse spatial sampling that simulates field measurements, and orange areas show the areas classified as gaps under both schemes.
