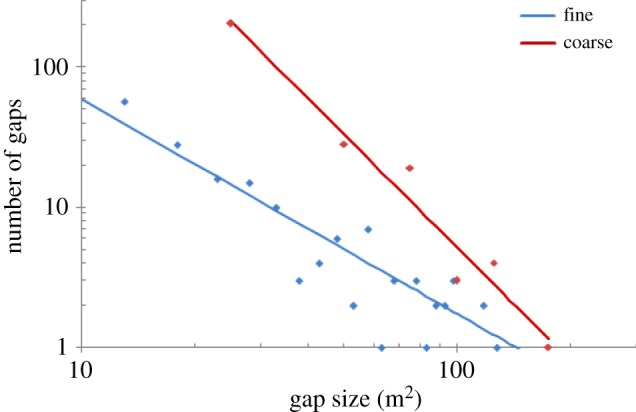
Figure 7.

Gap-size-frequency distributions for the 50 ha plot generated using a fine spatial resolution (1 m2 quadrats) and coarse resolution (25 m2 quadrats). The distributions were fit to a power-law using OLSs after a logarithmic transformation (p < 0.005 for all parameter estimates). (Online version in colour.)
