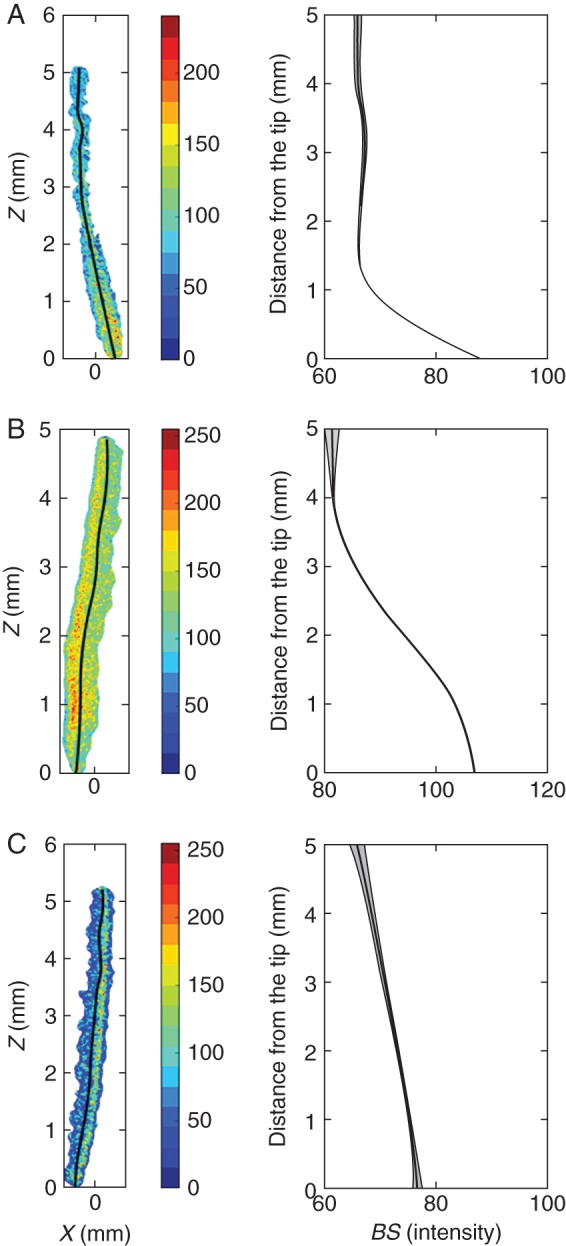
Fig. 3.

Plant species showed different root biospeckle activity maps. Images on the left show reconstructed activity maps using the Fujii method. Images on the right show the variations of biospeckle intensity (BS) along the root axis. (A) Jatropha roots had moderate overall biospeckle intensity, with a sharp decrease in biospeckle intensity in the first millimetre from the root tip. (B) Maize roots had high biospeckle intensity, and biospeckle intensity decreased over the first 3 mm from the root tip. (C) Citrus had the lowest root biospeckle intensity of the three species studied, and the decrease in biospeckle intensity with distance from the root tip was less marked in citrus than in jatropha or maize. Data represent means (lines) ± s.e. (grey shading) from 18 images of biospeckle activity in roots of jatropha, 72 images in roots of maize and 10 images in roots of citrus.
