
Fig. 7.
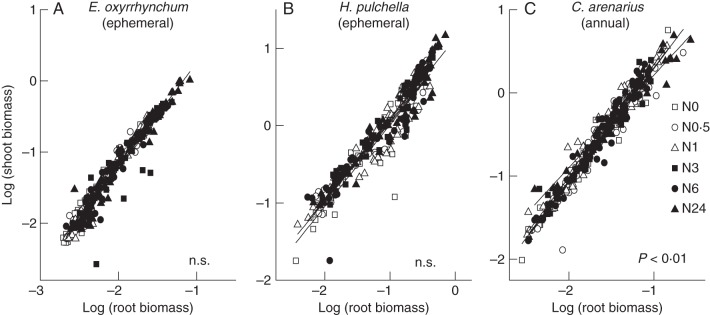
Bivariate log–log plots of shoot vs. root growth for E. oxyrrhynchum (A), H. pulchella (B) and C. arenarius (C) over the vegetative growth period in response to six different N treatments (all sampling dates were pooled). Linear curves take the form log shoot = αRMA log10 root + log10 βRMA. The probability values reported correspond to tests of the hypothesis that the curves do not differ. ‘n.s.’ indicates that no significant differences were found.