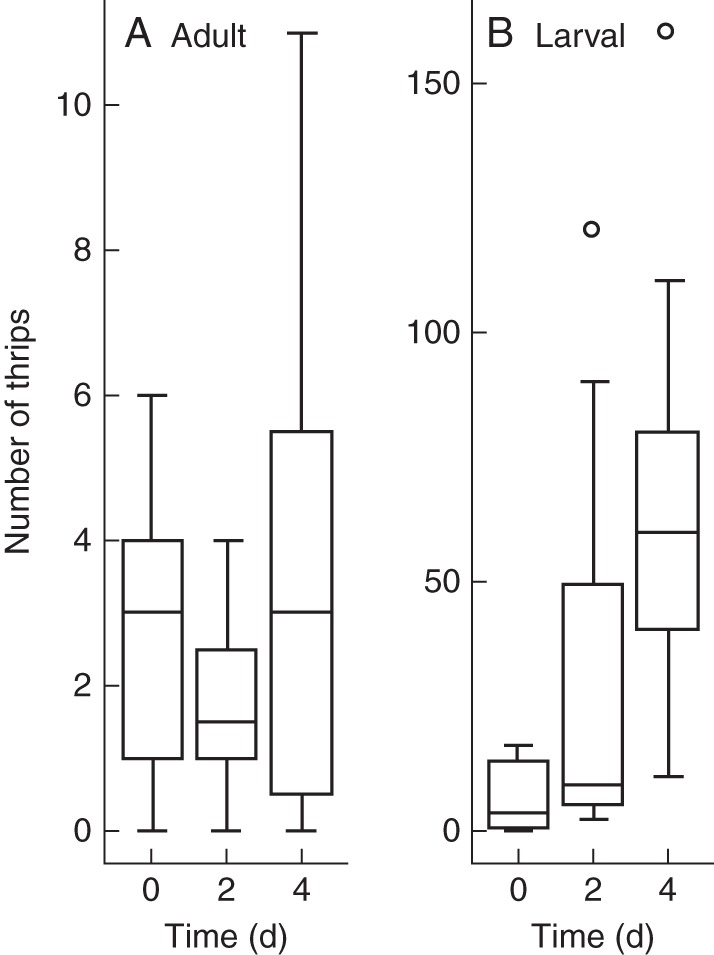
Fig. 10.

Boxplot diagrams showing the number of (A) adult and (B) larval thrips in a male spike of Platycarya strobilacea at M1 stage after 0, 2 and 4 d of storage. The bottom and top of each box are the lower and upper quartiles, respectively, and the horizontal bar is the median. The upper and lower ends of the whiskers represent the maximum and minimum, respectively, except for outlier values indicated by open circles.
