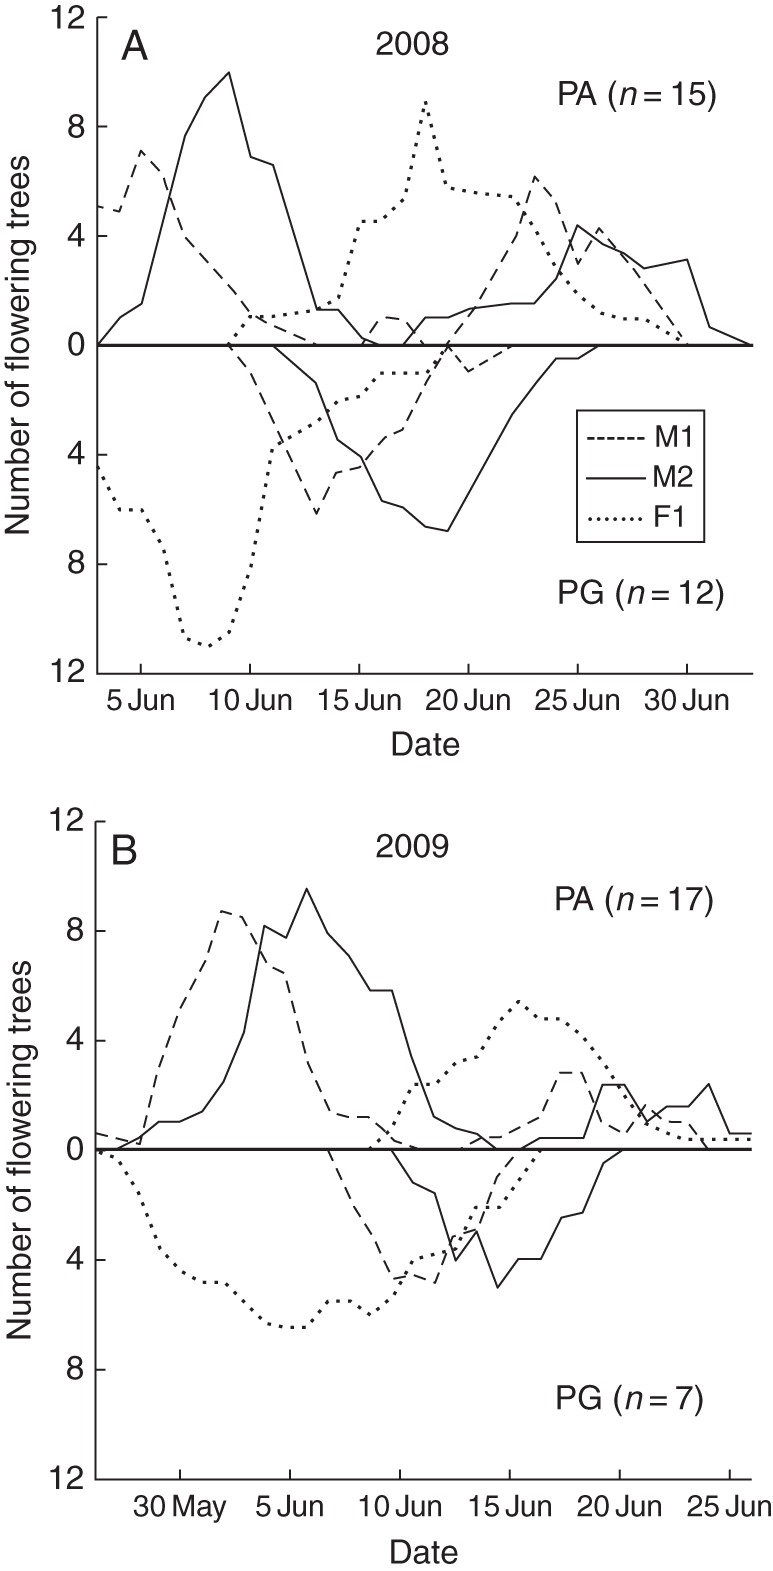
Fig. 5.

Temporal changes of the estimated number of Platycarya strobilacea trees in male (M1 and M2) and female (F1) stages in (A) 2008 and (B) 2009. Curves of protandrous (PA) trees, including functional males, are shown above and those of protogynous (PG) trees are shown below the central horizontal axis. In each male spike or male portion of androgynous spike, the showy and scent-emitting stage M1 is followed by the less attractive stage M2. For detailed definition of the stages, see Table 1.
