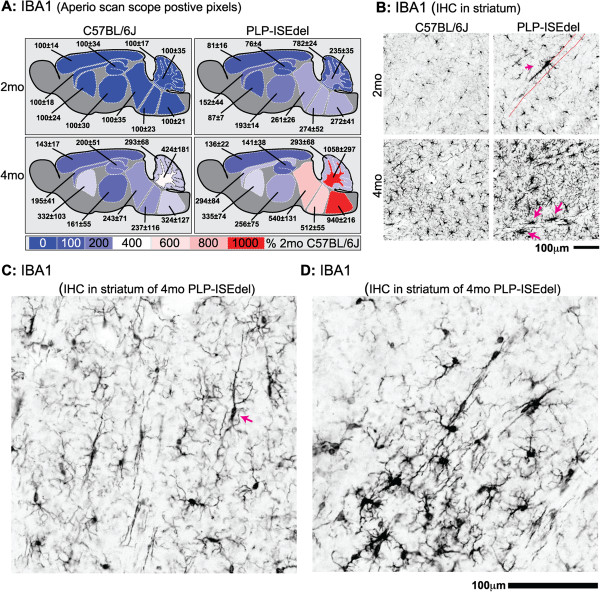
Figure 4.
Ionized calcium-binding adapter molecule 1 (IBA1) staining shows increased microglia activation in PLP-ISEdel mice. (A) Quantification of the IBA1 staining in the outlined regions is shown as a heat map, with the average of the signal of the 2-month-old wild-type (WT) mice for each brain region used as 100%. Mean ± SEM for each brain region is indicated (n = 5 to 6 per group). (B) Morphological changes show microglia activation (magenta arrow) along a white matter tract (indicated by red dashed lines). The microglia exhibited a loss of their normal uniform spatial distribution, and instead showed a more linear distribution (magenta arrow) (C) or clusters of strongly activated cells (D).

