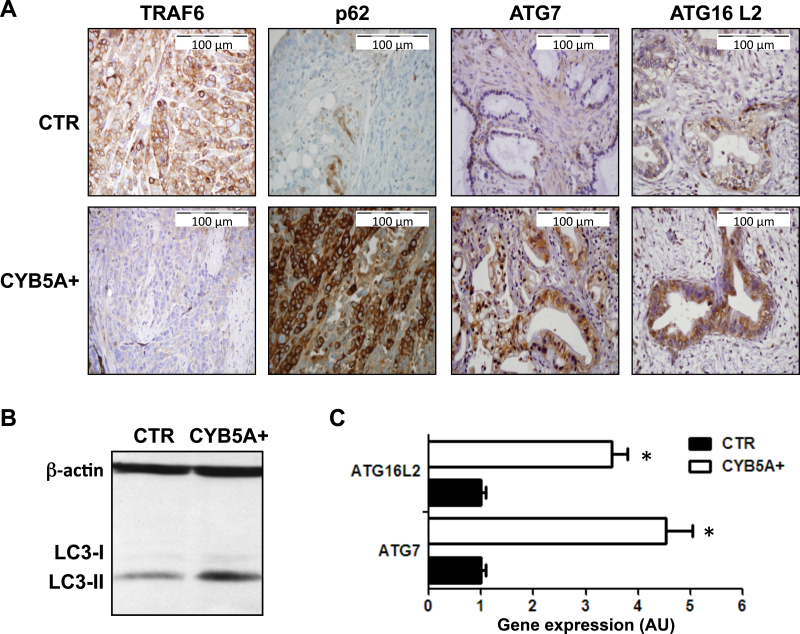
Figure 5.
Effects of CYB5A overexpression on autophagy induction in vivo. A) Representative IHC images showing a weak staining for TRAF6 and strong staining for ATG7, ATG16L2, and p62 in PDAC-2-CYB5A+ mice, compared with strong staining for TRAF6 and weak/intermediate staining for ATG7, ATG16L2, and p62 in PDAC-2 control (CTR) mice. B) Immunoblot showing the overexpression of LC3-II in lysates from frozen tissues from the PDAC-2-CYB5A+ mice compared with the PDAC-2 CTR mice. C) Polymerase chain reaction results (arbitrary units [AUs] calculated with the 2-ΔΔCt method) showing the increased expression of the autophagy genes ATG7 and ATG16L2 in lysates from frozen tissues from the PDAC-2-CYB5A+ mice compared with the PDAC-2 CTR mice. P values were calculated with two-sided Student t test. Columns indicate mean values obtained from the analysis of the six mice in each group. Bars indicate standard deviation. *P < .05.

