
Fig. 1.
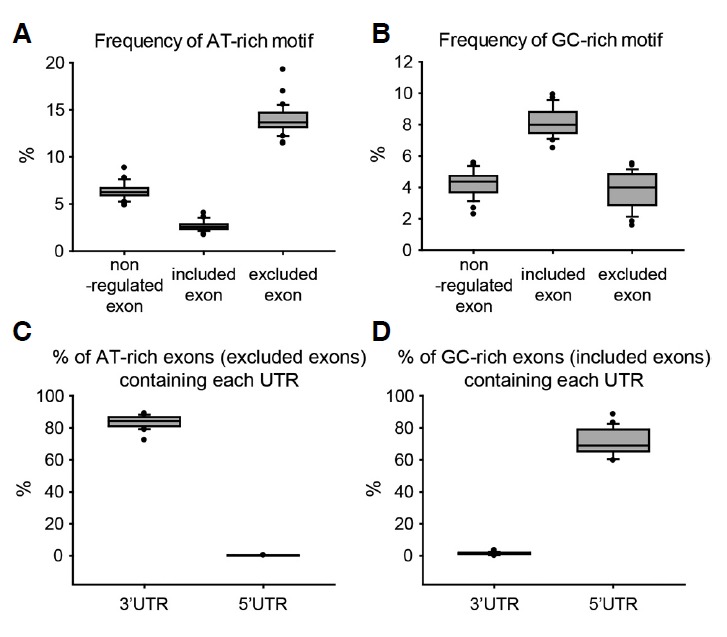
Characterization of exon variants associated with pressure-overload cardiac hypertrophy. (A) Box plots showing the frequency (%) of AT-rich motifs in exon variants and non-regulated exons. (B) Box plots showing the frequency (%) of GC-rich motifs in exon variants and non-regulated exons. (C) Box plots showing the percentage of AT-rich-excluded exons containing 3′ or 5′ UTRs. (D) Box plots showing the percentage of GC-rich-included exons containing 3′ or 5′ UTRs.