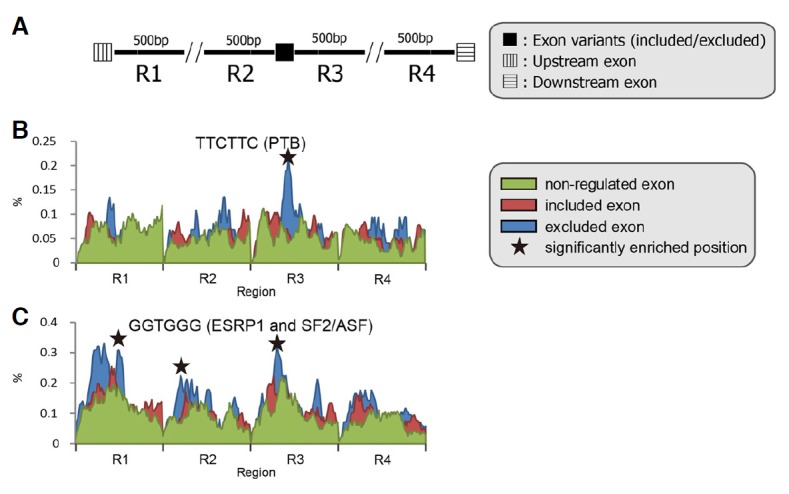
Fig. 2.

Positional information for enriched intronic motifs associated with pressure-overload cardiac hypertrophy. (A) A schematic view of the intronic regions used in the analysis. (B, C) Positional frequency of representative enriched intronic motifs (R1–R4 on the x-axis indicates the 70 bp adjacent to each exon). The splicing factors predicted to bind to the indicated intronic motifs are shown in parentheses. The black star symbols represent the positions of the significantly enriched intronic motifs. Additional information on the intronic motifs is shown in Supplementary Table 2.
