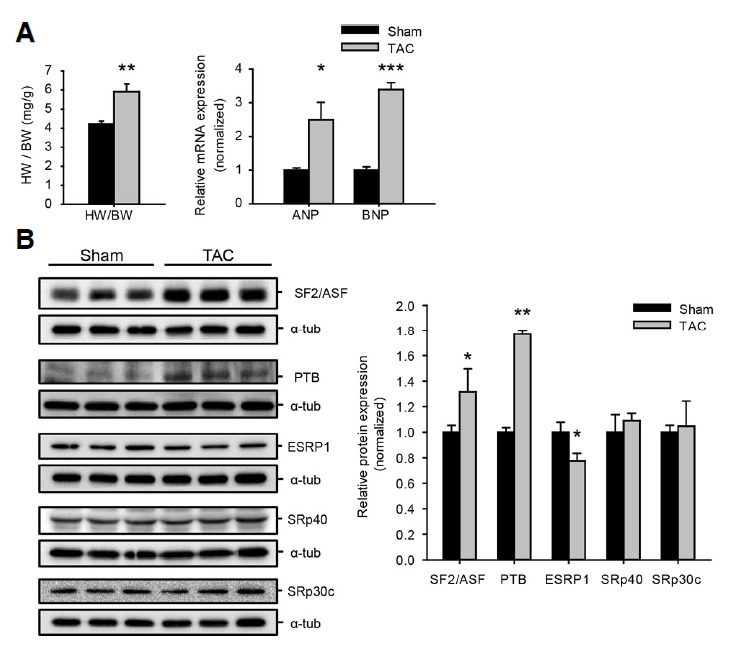
Fig. 3.

Protein expression levels of the splicing factors bound to the putative motifs in pressure-overload cardiac hypertrophy. (A) Heart weight/body weight ratio (HW/BW) at 1 week after Sham or TAC operation (left panel). The relative expression levels of the hypertrophic markers in the mouse models were determined by qRT-PCR (right panel). The differences are statistically significant at *p < 0.05, **p < 0.01 and ***p < 0.001 (The student t-test). Bars repre-sent means ± SD (n = 3). (B) The relative protein expression levels of the putative splicing factors bound to the identified intronic motifs were measured by Western blotting. Bars represent means ± SD (n = 3). The differences are statistically significant at *p < 0.05, **p < 0.01 (The student t-test).
