
Fig. 3.
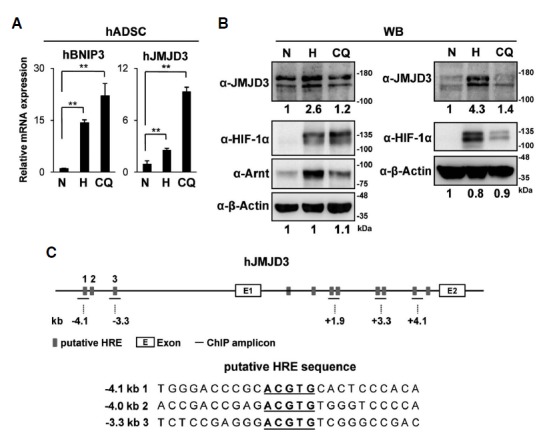
Hypoxic induction of human JMJD3 in hADSC. (A, B) hADSC were treated with hypoxia (<0.5% O2, 48 h) or Clioquinol (50 μM, 16 h); (A) The relative mRNA levels of BNIP3 and JMJD3 were analyzed by qRT-PCR. The data represent the average and standard deviations of two independent experiments; (B) Western blot analyses were performed using the indicated antibodies. The results of two independent experiments were shown. The relative intensity of each band was measured as described in Fig. 1E. (C) The putative HREs in the human JMJD3 gene are identified as described in Fig. 2C. The bars indicate the positions of the primer sets used for the ChIP analyses. The nucleotide sequences of putative HRE sites (−4.1 kb, −4.0 kb, −3.3 kb) and flanking regions were shown (lower panel). The p-values were obtained using the Student’s t-test and the significance between the groups is indicated (**p < 0.05).