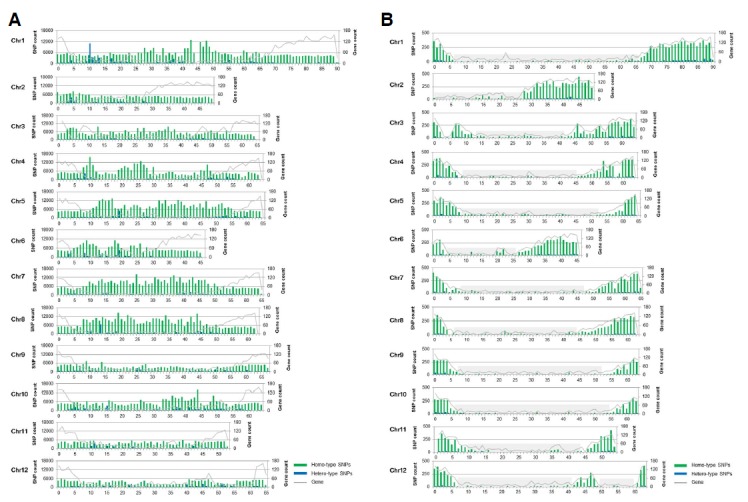
Fig. 3.

The distribution of SNPs detected with (A) resequencing and (B) transcriptome data along 12 chromosomes from the S. pimpinellifolium. Homo- and hetero-type SNPs exhibit varied distribution across different chromosomes. The left y-axis represents the number of SNPs while the right y-axis indicates gene count. The horizontal x-axis represents the length (Mb) of each chromosome. Gray shade boxes in (B) are regions identified low gene number.
