Figure 4.
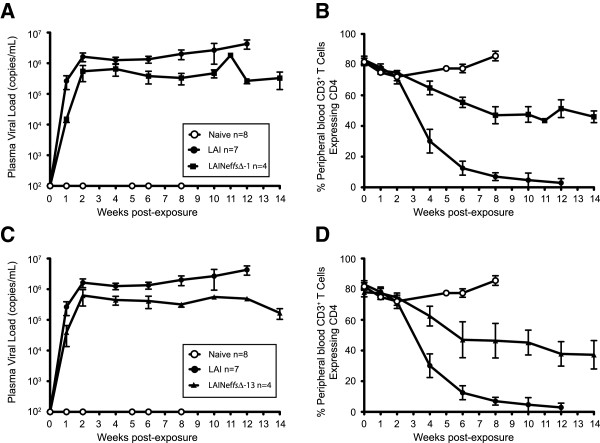
Viral load analysis and peripheral blood CD4+ T cell depletion in mice infected with LAI. (A) Viral loads (copies of LAI RNA per milliliter of plasma) of BLT humanized mice exposed to 90,000 TCIU of LAI or LAINeffs∆-1 were plotted. Uninfected mice (Naïve) served as negative controls (open circle, n = 8); LAI (filled circle, n = 7); and LAINeffs∆-1 (filled square, n = 4). (B) Plot of percent peripheral blood CD3+ T cells expressing CD4. Naïve mice, LAI and LAINeffs∆-1 as in (A). (C) Viral loads were plotted following inoculation of 90,000 TCIU of LAI or LAINeffs∆-13. Naïve mice as negative controls (open circle, n = 8); LAI (filled circle, n = 7); and LAINeffs∆-13 (filled triangles, n = 4). (D) Plot of percent peripheral blood CD3+ T cells expressing CD4. Naïve mice, LAI and LAINeffs∆-13 as in (C).

