Figure 1.

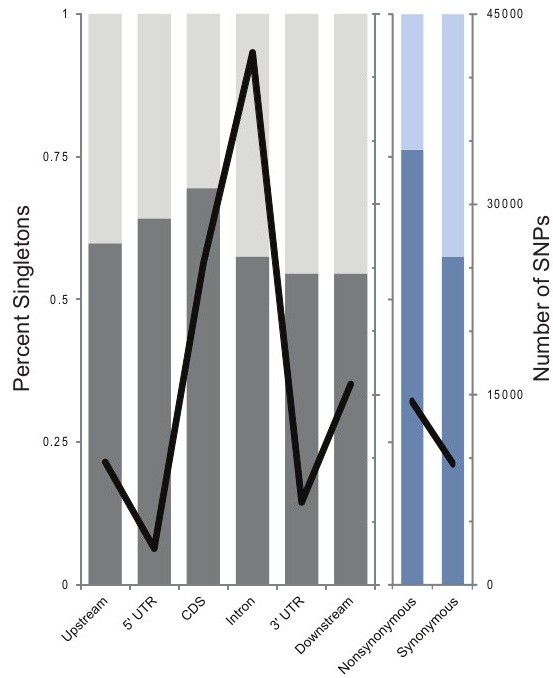
SNP annotation by category. Singletons are light and SNPs found in multiple individuals are dark. Line graph shows number of SNPs identified.

SNP annotation by category. Singletons are light and SNPs found in multiple individuals are dark. Line graph shows number of SNPs identified.