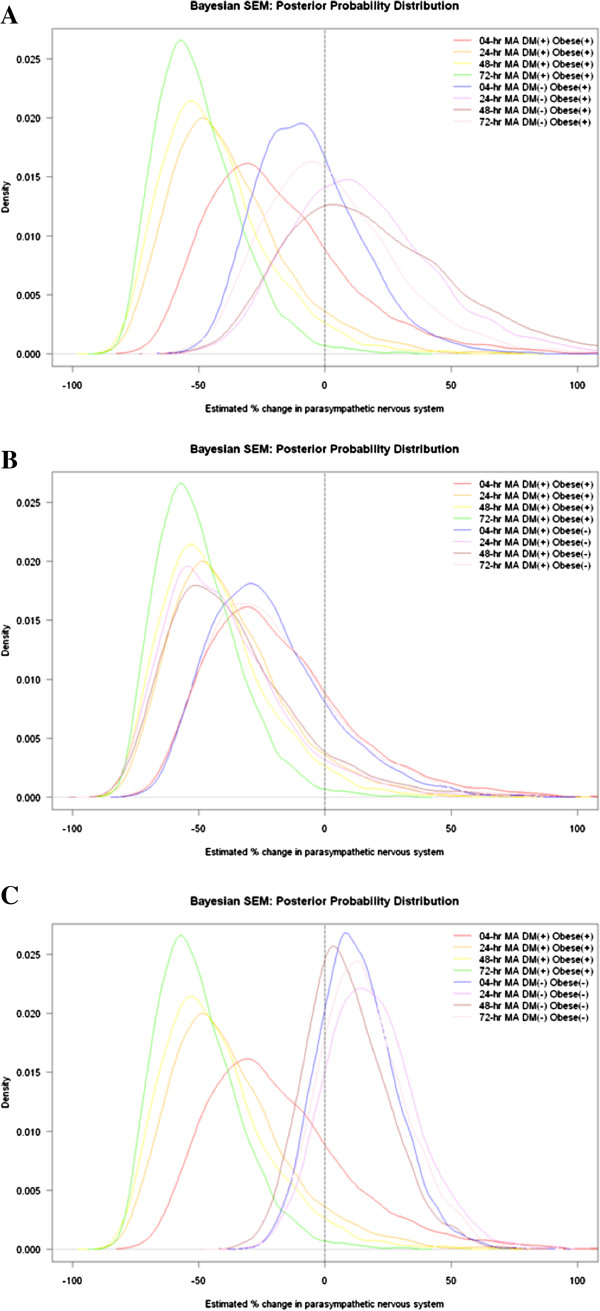
Figure 3.

Adjusted density plots of posterior estimated percentage change in parasympathetic tone associated with an inter quartile range (IQR) increase in traffic pollution at different hourly moving averages (MA), by patient characteristics [diabetic status (doctor’s diagnosis of diabetes or fasting blood glucose (FBG) >126 mg/dL, vs. no diagnosis or FBG ≤126 mg/dL), and obesity (body mass index (BMI) ≥ 30, <30)]. (A) Diabetic vs. non-diabetic among obese participants, (B) obese vs. non-obese among diabetic participants, and (C) diabetic and obese participants vs. non-diabetics and non-obese participants.
