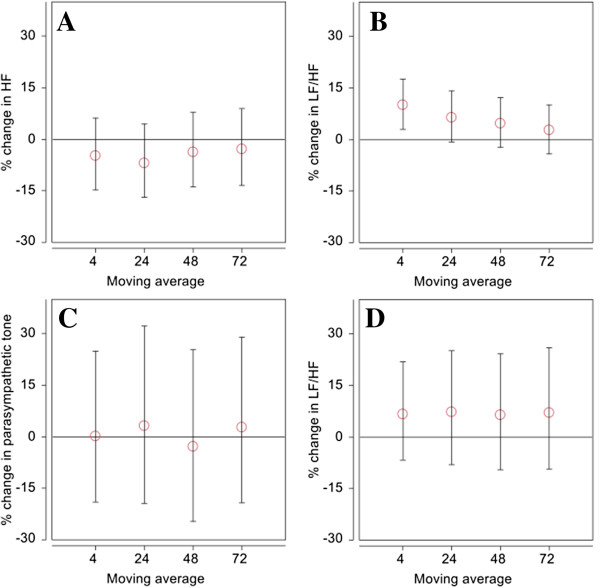
Figure 4.

Comparison of estimated percentage change in health effect outcome associated with an interquartile range (IQR) increase in either black carbon (BC) or traffic exposure at different moving averages (MA). (A) BLMM: effect of BC on high frequency HRV (HF), (B) BLMM: effect of BC on sympathetic tone marker, low frequency to high frequency ratio (LF/HF), (C) SEM: effect of traffic on parasympathetic tone, and (D) SEM: effect of traffic on LF/HF. Error bars indicate 95% posterior interval.
