Fig. 5.
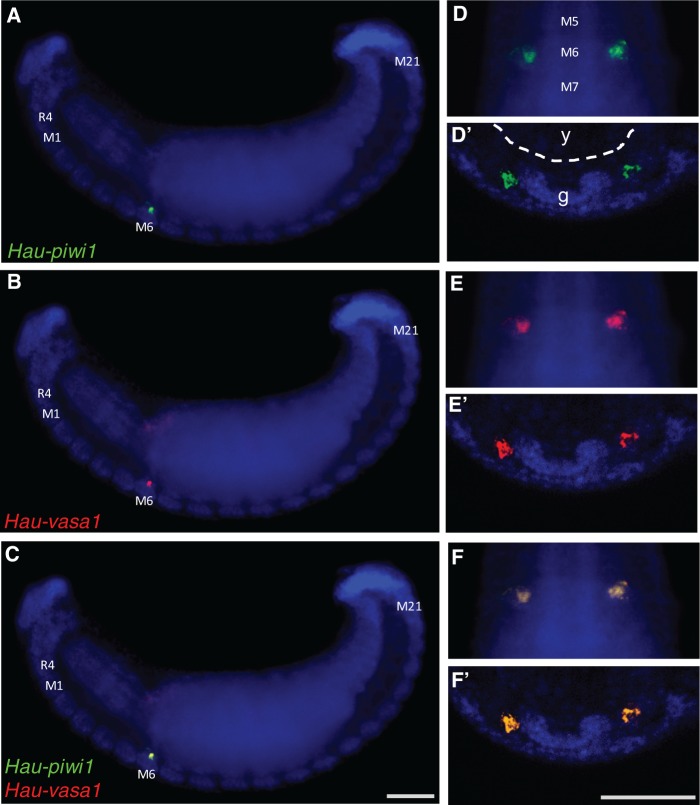
Coexpression of Hau-piwi1 and Hau-vasa1 in female PGCs. Two color fluorescent in situs for Hau-piwi1 (green; A, D, D′) and Hau-vasa1 (red; B, E, E′) and merged views (C, F, F′). Nuclei were counterstained with DAPI (blue). (A, B, C) Lateral view, anterior to left, showing the entire early stage 11 embryo. Labels indicate rostral segment 4 (R4), and midbody segments 1, 6, and 21 (M1, M6, M21). (D, E, F) Ventral view, anterior up, showing midbody segments 5, 6, and 7 (M5, M6, M7). (D′, E′, F′) Transverse section, ventral down, through midbody segment 6; labels in (D') indicate yolk (y) within the developing midgut (dotted contour) and the segmental ganglion (g). Scales bars, 100 µm in (A–C); 50 µm in(D–F) and (D′–F′).

