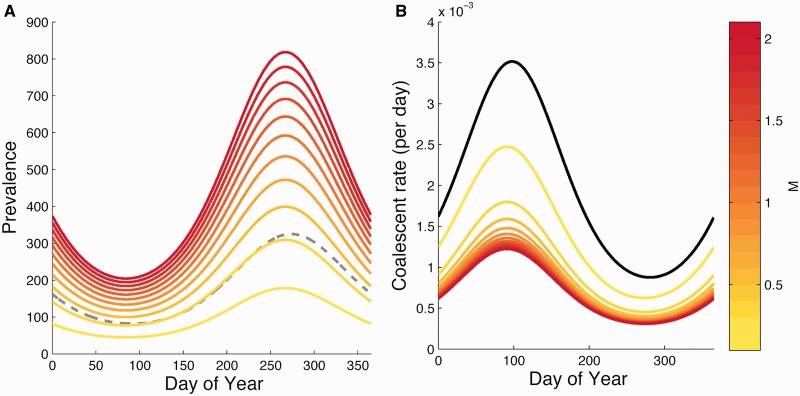
Fig. 3.
Comparison of seasonal coalescent rates and mosquito population sizes for the direct transmission model and the vector-borne model. (A) Simulated seasonal prevalence of the disease in humans and mosquitoes. The different colored lines show disease prevalence in mosquitoes assuming different values of M. Prevalence in humans (dashed-gray) is also seasonal, and constrained to be the same for both the direct and vector-borne model by keeping R0 constant. (B) Seasonal coalescent rates for both models. The black line shows the seasonal coalescent rate for the direct transmission model and the different colored lines are the coalescent rates for the vector-borne model.

