
Fig. 5.
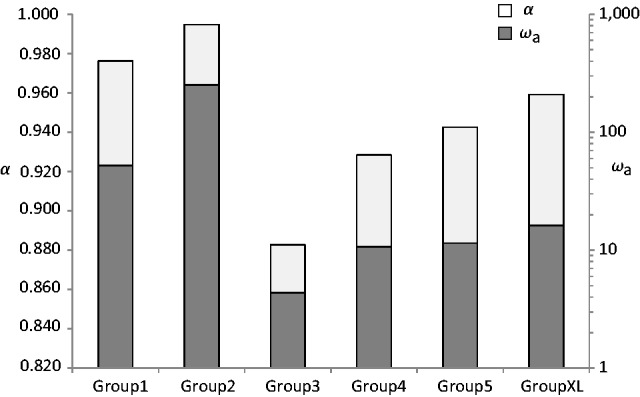
Diagram showing α, the proportion of amino acid substitutions driven by positive selection (white bars, left scale) and ωa, the rate of adaptive nonsynonymous substitutions, relative to the rate of synonymous substitutions (gray bars, right scale) calculated in the flanking region of the HVR for groups of csd alleles harboring different length of the repetitive region. In total, 87 csd alleles were grouped into seven sets that contained csd alleles with an amino acid repeat length ranging 6–12 (group 1, n = 13), 13–16 (group 2, n = 15), 17–20 (group 3, n = 22), 21–23 (group 4, n = 14), 24–26 (group 5, n = 11), and 27–33 (group XL, n = 12).